DDDM and the 5 Levels of Data Maturity
by Steve Yatson, Chief Evangelist

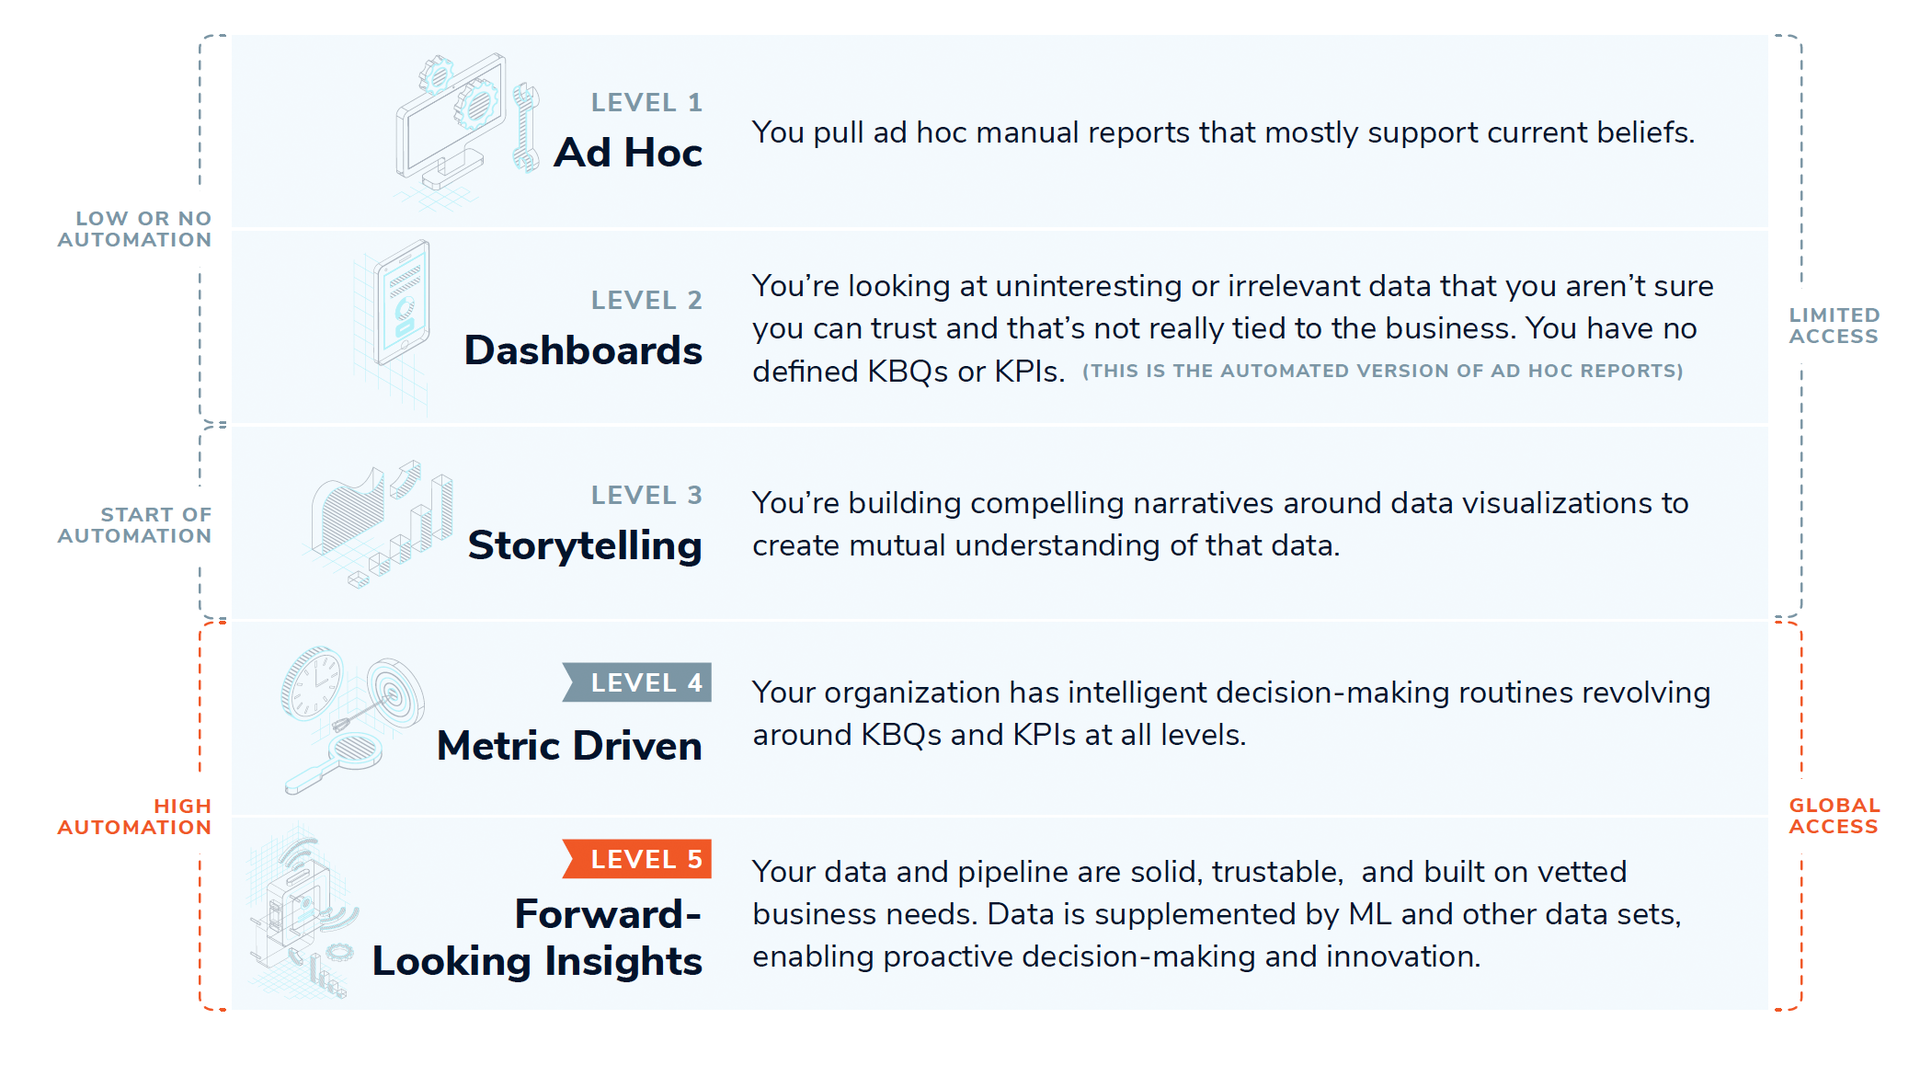
At productOps, we look at data proficiency from a number of different perspectives, just as most organizations do. In order to align different parts of the organization—for example, Sales and IT—we first assess where the organization is on a Data Maturity scale of 1–5, with level 5 being very forward-looking and predictive (see fig 1). Then we work with all parties to understand the current level so we can build common goals and a strategy for improving.
As Maturity Level Increases, the Value of Your Data Increases
Expanding access to data, and increasing the organization’s ability to govern that data, means more ideas and more potential solutions are realized. In turn, those projects generate new comprehensible and trustworthy data.
What Is DDDM?
Data-driven decision-making (DDDM) is the organizational practice of using data to influence, predict, and measure strategic business decisions against desired outcomes.
Think of Your Data Culture as a Journey
Traditionally, organizations would “pull reports” on a specific set of data for the limited viewing of a few select decision makers, typically upper management. Think spreadsheets and the antiquated notion of the executive dashboard. In modern data-driven organizations, the entire data set is well governed and widely available. Instead of a few key executives making decisions from possibly outdated information, everyone has access to up-to-date information and an opportunity to influence strategic decision-making. If an issue with a motor occurs in the field, for example, someone on the assembly line can quickly understand possible causes in the assembly process.
Data Maturity Self Assessment
What follows is a quick self assessment. Read through the brief description of each of the 5 levels of data maturity and answer the subsequent questions. This will give you an idea of where organization is at, and where you may need assistance.
DDDM Maturity Level 1: Ad Hoc
You pull ad hoc manual reports that mostly support current beliefs. Very few people in the organization can view the data or participate in the decision making process.
Questions
- Are you asking a person for the data?
- Are spreadsheets your only or preferred tool?
- Do individual departments define their own metrics?
LOW OR NO AUTOMATION | PRESCRIPTIVE | LIMITED VIEW
DDDM Maturity Level 2: Dashboards
You’re looking at data that you aren’t sure you can trust and that’s not explicitly tied to your business goals. You have no defined KBQs (Key Business Questions) or KPIs (Key Performance Indicators). This is the automated version of the ad hoc reporting that is the norm for Level 1.
Questions
- Are you asking the system for the data?
- Do you have standard definitions for relevant terms? (Example: How is an active user defined by different members of the organization?)
- Do you have a standard place for people to retrieve report information?
LOW OR NO AUTOMATION | PRESCRIPTIVE | LIMITED VIEW
DDDM Maturity Level 3: Storytelling
You’re building compelling narratives around data visualizations to create mutual understanding of that data. View of the data is expanded and decision making is now influenced by more people and by inferences based on data.
Questions
- Can you dig in and look at data in different ways other than as a static dashboard?
- Are you combining data from multiple relevant sources?
- Are you able to drill down into the data you have?
START AUTOMATION | INFERENTIAL | EXPANDED VIEW
DDDM Maturity Level 4: Metric Driven
Your organization has intelligent decision-making routines (see fig 2) revolving around KBQs and KPIs at all levels. All appropriate people in the organization have access to the data.
Questions
- Are you supporting or defending decisions with KBQs, KPIs, and OKRs defined?
- Have the data silos been torn down and data made available organization-wide?
- Do you have a review process to monitor continued improvement of business goals?
- Is your data trusted by the organization and under a full governance plan? Data Governance
HIGH AUTOMATION | INFERENTIAL | GLOBAL ACCESS
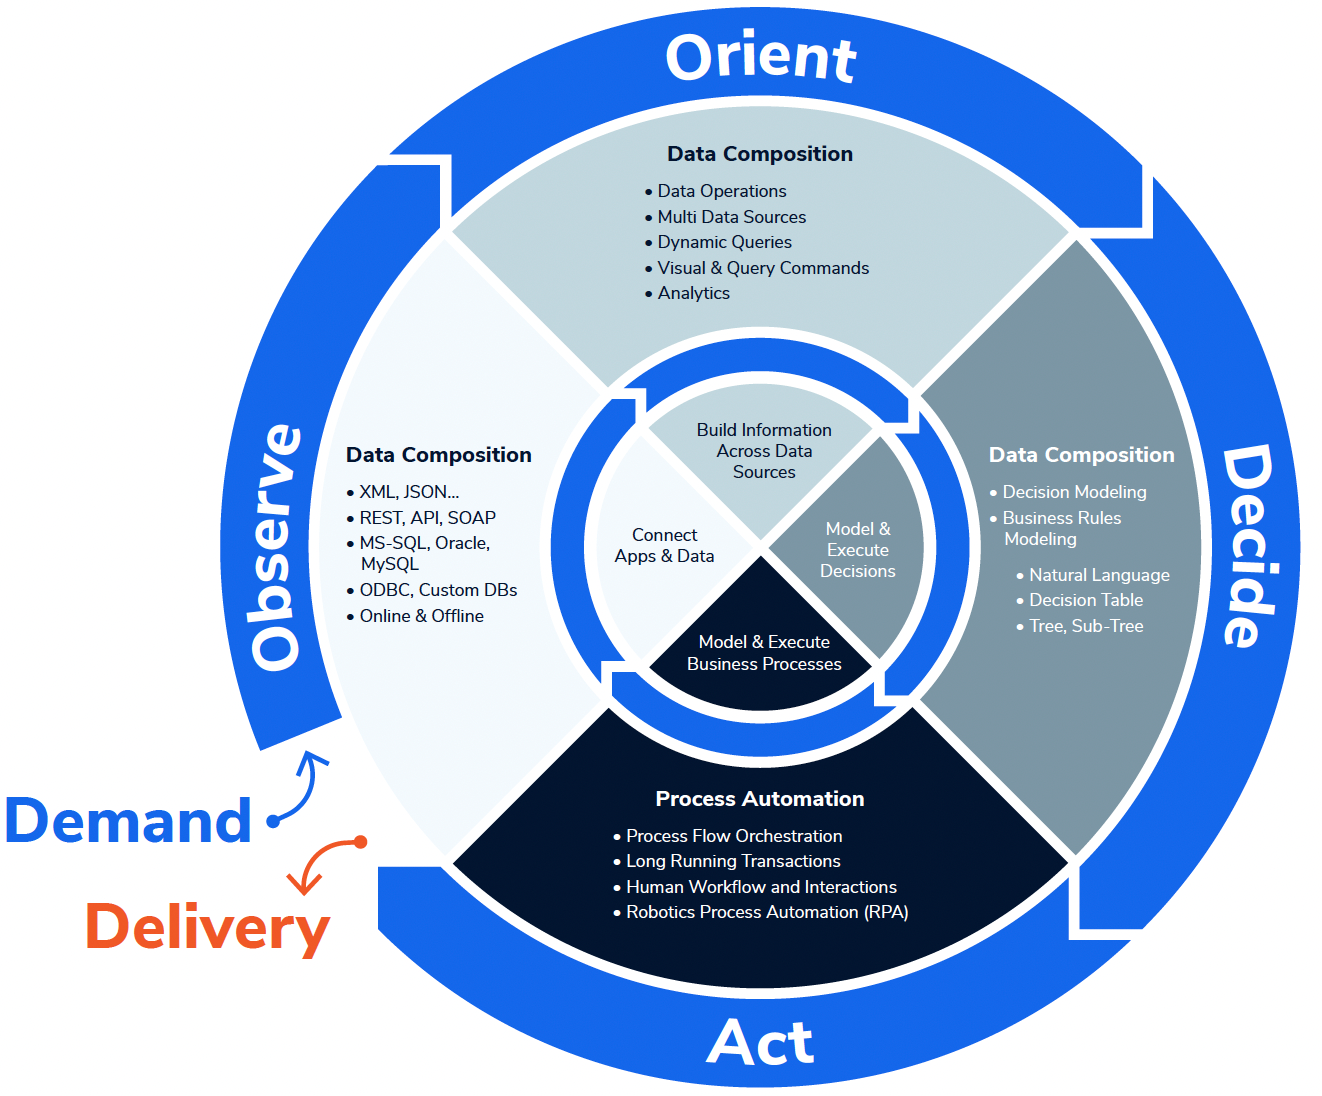
Figure 2: OODA Diagram: Observe, Orient, Decide, and Act